- Deriving Equation 4: d=V2Δt-½aΔt²
Well, equation 4 is sort of different from equation 3 but they do share some same components, such as the triangle part. However, the rectangular part is the major difference. The purpose of equation 4 is to utilizes a larger rectangle to subtract the triangular part to find the trapezoid area.
In this equation, we can find out the area of the larger rectangle by substituting V2 as the height. So the equation would look like: d=V2Δt.
Finally, you need to subtract the triangular value from the value of the large rectangle to form the trapezoid. So the final equation looks like this:
d=V2Δt-½aΔt² ; D
Friday, October 22, 2010
Deriving Equation 3
- Deriving Equation 3: d=V1Δt + ½aΔt²
Our goal in this equation is to find the displacement. We can do that by finding the area of the trapezoid made by the slope and the x axis. The equation basically divided the area of the trapezoid into two parts: a triangle and a rectangle.
The formula for the area of a triangle is A= bh/2. If we apply to that equation for the values on the triangle on the graph, the equation would be d= (v2-v1)Δt /2. To simplify this equation, we can replace (v2-v1) with aΔt. So the new equation would look like
d=½ (aΔt )Δt
d=½ aΔt²
and there we have the second part of equation 3 and now we have to derive the rectangular part.
The formula for the area of a rectangle is A=lw. If we apply to that equation for the values on the rectangle on the graph, the equation would be d= v1(t2-t1). We can simplify this equation further by replacing (t2-t1) with Δt.
d=V1Δt and here we have the first part of equation 3.
Finally, we combine the two equations together and the result is d=V1Δt + ½aΔt² - equation 3. : )
Wednesday, October 20, 2010
Translating Graphs Thingys
Graph 1
 We 80 cm from the motion detector. We walked @ a constant speed... ok... tried to walk away @ a constant speed and we stopped. Then, we walked forward and stopped the rest of the graph.
Graph 2
 k for this one, we started @ 3 m, we walked towards the motion detector for @ a constant speed for 3 secs and we stopped.@ 4 secs we continued to walk away and stopped @ 5 secs. Finally, we walked away from the motion detector @ a constant speed until 10 secs.
Graph 3
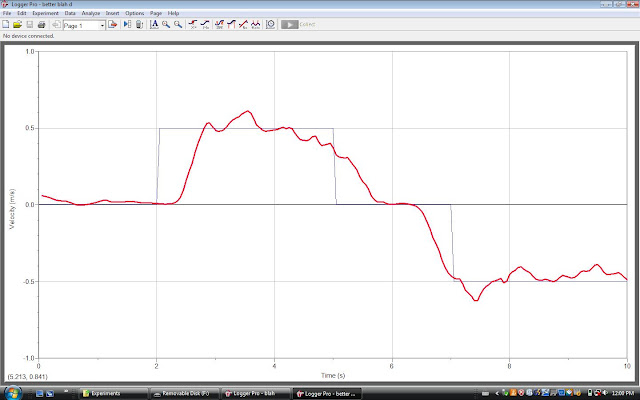
This is a velocity/time graph and it is probably one of the hardest to walk. From 0 to 2 secs, our motion was still. From 2 secs to 5 secs, we were @ a constant velocity of 0.5 m/s. From 5 to 7, our motion was still again. Finally, from 7 to 10 secs, we walked @ a constant velocity of -0.5 m/s.
Graph 4
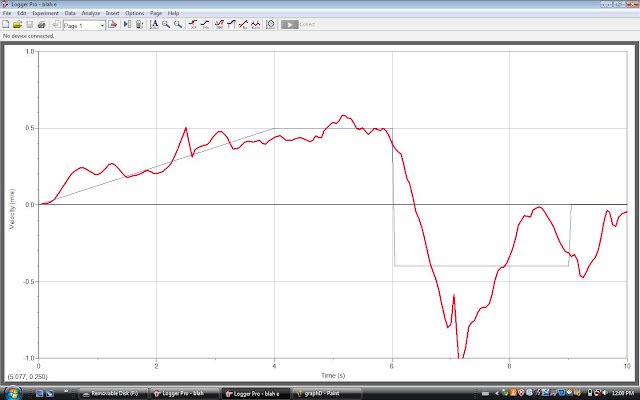
Just when i thought it graph 3 was the hardest one to walk... here comes graph 4. I gotta say... this is the worst result we got in this experiment. Graph 4 is also a velocity/time graph. In the first 4 secs, the velocity increase constantly to 0.5 m/s. From 4 secs to 6 secs, the velocity 0.5 m/s. From 6 secs to 9 secs, the velocity, is about -0.4. @ 9 - 10 secs, our motion was still.
Graph 5

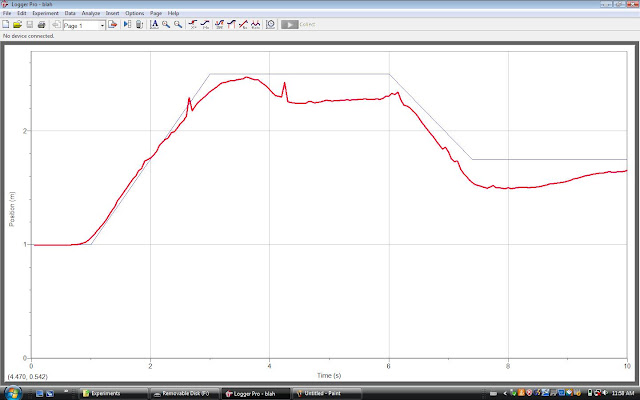
Graph 5 is a distance time graph. From start to about 3.5 secs, we moved away from the motion detector @ a constant speed. Then we stood still and started moving further away from the motion detector @ about 6.3 secs.
Graph 6
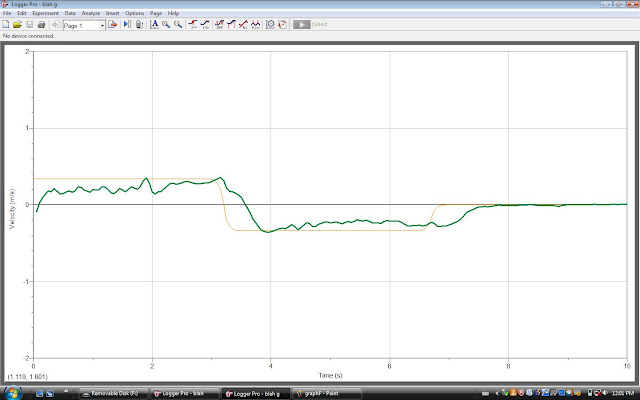
Graph 6 is another velocity/time graph. We moved @ a constant speed of about 0.2 m/s for the first 3 secs.
Then from 3 secs to 6.2 secs, our velocity was about - 0.4. For the rest of the graph, our motion was still.

Graph 2

Graph 3
This is a velocity/time graph and it is probably one of the hardest to walk. From 0 to 2 secs, our motion was still. From 2 secs to 5 secs, we were @ a constant velocity of 0.5 m/s. From 5 to 7, our motion was still again. Finally, from 7 to 10 secs, we walked @ a constant velocity of -0.5 m/s.
Graph 4
Just when i thought it graph 3 was the hardest one to walk... here comes graph 4. I gotta say... this is the worst result we got in this experiment. Graph 4 is also a velocity/time graph. In the first 4 secs, the velocity increase constantly to 0.5 m/s. From 4 secs to 6 secs, the velocity 0.5 m/s. From 6 secs to 9 secs, the velocity, is about -0.4. @ 9 - 10 secs, our motion was still.
Graph 5

Graph 5 is a distance time graph. From start to about 3.5 secs, we moved away from the motion detector @ a constant speed. Then we stood still and started moving further away from the motion detector @ about 6.3 secs.
Graph 6
Graph 6 is another velocity/time graph. We moved @ a constant speed of about 0.2 m/s for the first 3 secs.
Then from 3 secs to 6.2 secs, our velocity was about - 0.4. For the rest of the graph, our motion was still.
Subscribe to:
Posts (Atom)