Personally, I am NOT a big fan of roller coasters because it brings back memories such as this one...
It was a hot day during the summery break and me and my friends decided to take a trip to Toronto and visit Canada's Wonderland.(i went to elementary school in Ottawa, so like coming to Wonderland was a big deal)
We got up early and arrived at about 1 in the afternoon. We were so excited as we went on 6-7 coasters in a roll.
Before we know it, it was almost 4 and we were starving because none of us had lunch. So we decided to get lunch. As i remembered clearly, i had bought a fries supreme from NY fries. It turned out to be one of the worst decision i've made.
After i chowed down my fries, i decided to go right back to coaster riding as i was determined to not miss even one moment of this awesome funess. Before i knew it, my butt was on the seat of "The Bat" then everything went wrong...
As the ride was lifting off, i felt great, i was still chatting and waiting anxiously for it to accelerate. BUT after the ride was accelerating faster plus the twist and turning, i began to have this funny feeling in my stomach. After about the 4th turn, my face was completely pale and my stomach felt so bad that i can barely breathe! But i was determined to make it out of this ride, without causing a whole mess... i held back the vomiting. Then the ride flip me side ways, backwards, even upside down. By that point, my fries that i ate early were literally at my throat... HOWEVER, with A LOT of efforts, i managed to keep my fries at my throat. Finally the ride came to an end and i can see the enter and exit platform. i felt so relived and just when i thought i was going to make it, the coaster made a rather rash stop. As i leaned forward and as the seat belt compressed my stomach, brownish fluids exploded out of my mouth and even my nose. The next thing i remembered, i was sitting a bench not far from the ride with an angry,balding, middle aged man glaring down at me and trying to wipe his neck at the same time. At the end of the day, i had a lot of fun and i was also glad there weren't any lawsuits.
From that day on, I've never went on "The Bat" and i have never eaten New York fries. So that's my unique experience with roller coasters.
Tuesday, November 9, 2010
Physics behind rollercoasters
Generally, when people think of roller coasters, they think of a fun and exciting, vomit producing machine. But what many people don't realize is that there is also a wealth of Physics knowledge behind this functioning machine.
The first part of the roller coast normally involves work and energy. At the beginning of an average roller coaster ride, there will be mechanical forces such as a lift motor or a chain to help the roller coaster up a steep hill with little momentum. From there, gravity will take over.
 On the top of the steep hill, the coaster processes a lot of potential energy. This potential energy is created by the mechanical forces which gave coaster the height and the weight of the coaster also contributes to the potential energy.
As the coaster moves down, potential energy turns into kinematic energies. The more the coaster accelerates the bigger values of kinematic energy is being presented and at the same time, the value of potential energy decreases and react inversely. As the ride continues, the train of cars are continuously losing and gaining height. Each gain in height corresponds to the loss of speed as kinetic energy is transformed into potential energy. Each loss in height corresponds to a gain of speed as potential energy is transformed into kinetic energy. AND that's how a roller coaster works.
The first part of the roller coast normally involves work and energy. At the beginning of an average roller coaster ride, there will be mechanical forces such as a lift motor or a chain to help the roller coaster up a steep hill with little momentum. From there, gravity will take over.
As the coaster moves down, potential energy turns into kinematic energies. The more the coaster accelerates the bigger values of kinematic energy is being presented and at the same time, the value of potential energy decreases and react inversely. As the ride continues, the train of cars are continuously losing and gaining height. Each gain in height corresponds to the loss of speed as kinetic energy is transformed into potential energy. Each loss in height corresponds to a gain of speed as potential energy is transformed into kinetic energy. AND that's how a roller coaster works.
Thursday, November 4, 2010
How to add vectors
Vectors, simply put, are values that have direction and a magnitude. Velocity, acceleration, and displacement also determines the value of the vector. The addition of vectors can be summarized into 5 steps.
 1. First, determine each of the vector's direction. If it's moving eastwards or upwards, it has a positive and if it's moving west or downwards, it's negative. If a component has a negative sign (-), its magnitude is subtracted, rather than added.
2. Then, visualize or draw the diagram of the vectors and make it into a triangle.

 5. Finally, find the direction the vector is going. The direction will always be from the point of the
2. Then, visualize or draw the diagram of the vectors and make it into a triangle.
3. Next, we use the Pythagorean theorem "a² + b² = c²" to calculate the unknown side.
4. After finding the length of the missing side, find the angle using the "SOHCANTOA" rule to find the angle. Most of the time in vectors, Tangent is used most frequently. The equation will be θ=tan-1(b/a), where θ is the angle that the resultant makes with the x-axis or the horizontal.
Friday, October 22, 2010
Deriving Equation 4
- Deriving Equation 4: d=V2Δt-½aΔt²
Well, equation 4 is sort of different from equation 3 but they do share some same components, such as the triangle part. However, the rectangular part is the major difference. The purpose of equation 4 is to utilizes a larger rectangle to subtract the triangular part to find the trapezoid area.
In this equation, we can find out the area of the larger rectangle by substituting V2 as the height. So the equation would look like: d=V2Δt.
Finally, you need to subtract the triangular value from the value of the large rectangle to form the trapezoid. So the final equation looks like this:
d=V2Δt-½aΔt² ; D
Deriving Equation 3
- Deriving Equation 3: d=V1Δt + ½aΔt²
Our goal in this equation is to find the displacement. We can do that by finding the area of the trapezoid made by the slope and the x axis. The equation basically divided the area of the trapezoid into two parts: a triangle and a rectangle.
The formula for the area of a triangle is A= bh/2. If we apply to that equation for the values on the triangle on the graph, the equation would be d= (v2-v1)Δt /2. To simplify this equation, we can replace (v2-v1) with aΔt. So the new equation would look like
d=½ (aΔt )Δt
d=½ aΔt²
and there we have the second part of equation 3 and now we have to derive the rectangular part.
The formula for the area of a rectangle is A=lw. If we apply to that equation for the values on the rectangle on the graph, the equation would be d= v1(t2-t1). We can simplify this equation further by replacing (t2-t1) with Δt.
d=V1Δt and here we have the first part of equation 3.
Finally, we combine the two equations together and the result is d=V1Δt + ½aΔt² - equation 3. : )
Wednesday, October 20, 2010
Translating Graphs Thingys
Graph 1
 We 80 cm from the motion detector. We walked @ a constant speed... ok... tried to walk away @ a constant speed and we stopped. Then, we walked forward and stopped the rest of the graph.
Graph 2
 k for this one, we started @ 3 m, we walked towards the motion detector for @ a constant speed for 3 secs and we stopped.@ 4 secs we continued to walk away and stopped @ 5 secs. Finally, we walked away from the motion detector @ a constant speed until 10 secs.
Graph 3
This is a velocity/time graph and it is probably one of the hardest to walk. From 0 to 2 secs, our motion was still. From 2 secs to 5 secs, we were @ a constant velocity of 0.5 m/s. From 5 to 7, our motion was still again. Finally, from 7 to 10 secs, we walked @ a constant velocity of -0.5 m/s.
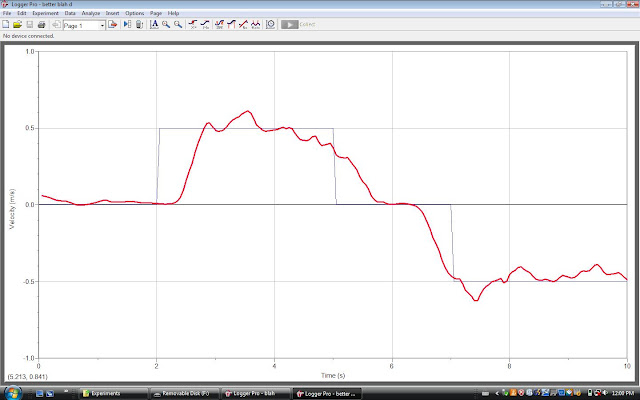
Graph 4
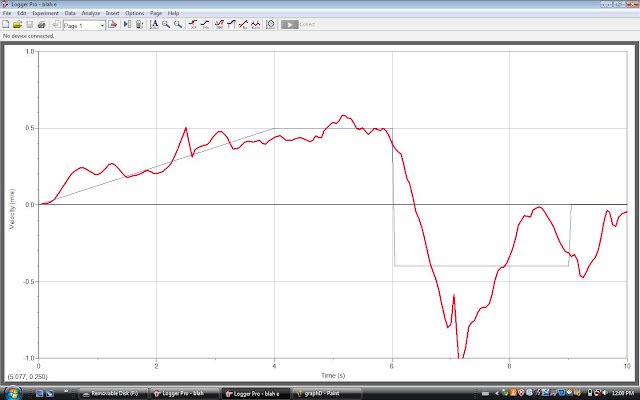
Just when i thought it graph 3 was the hardest one to walk... here comes graph 4. I gotta say... this is the worst result we got in this experiment. Graph 4 is also a velocity/time graph. In the first 4 secs, the velocity increase constantly to 0.5 m/s. From 4 secs to 6 secs, the velocity 0.5 m/s. From 6 secs to 9 secs, the velocity, is about -0.4. @ 9 - 10 secs, our motion was still.
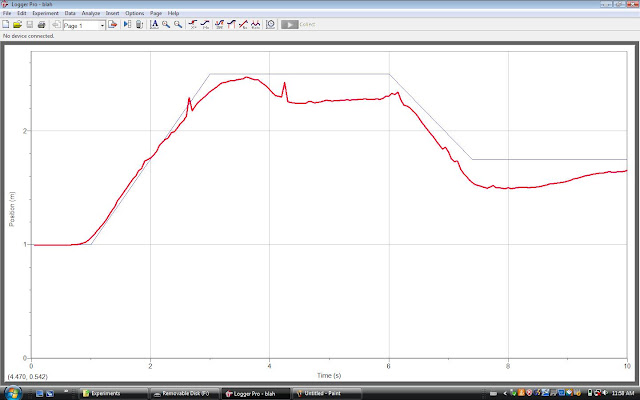
Graph 5

Graph 5 is a distance time graph. From start to about 3.5 secs, we moved away from the motion detector @ a constant speed. Then we stood still and started moving further away from the motion detector @ about 6.3 secs.
Graph 6
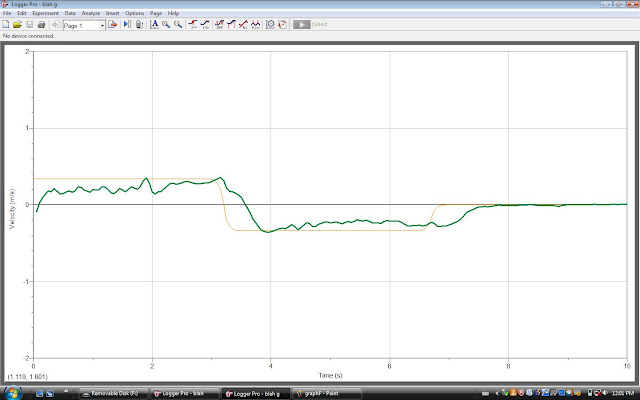
Graph 6 is another velocity/time graph. We moved @ a constant speed of about 0.2 m/s for the first 3 secs.
Then from 3 secs to 6.2 secs, our velocity was about - 0.4. For the rest of the graph, our motion was still.

Graph 2

Graph 3
This is a velocity/time graph and it is probably one of the hardest to walk. From 0 to 2 secs, our motion was still. From 2 secs to 5 secs, we were @ a constant velocity of 0.5 m/s. From 5 to 7, our motion was still again. Finally, from 7 to 10 secs, we walked @ a constant velocity of -0.5 m/s.
Graph 4
Just when i thought it graph 3 was the hardest one to walk... here comes graph 4. I gotta say... this is the worst result we got in this experiment. Graph 4 is also a velocity/time graph. In the first 4 secs, the velocity increase constantly to 0.5 m/s. From 4 secs to 6 secs, the velocity 0.5 m/s. From 6 secs to 9 secs, the velocity, is about -0.4. @ 9 - 10 secs, our motion was still.
Graph 5

Graph 5 is a distance time graph. From start to about 3.5 secs, we moved away from the motion detector @ a constant speed. Then we stood still and started moving further away from the motion detector @ about 6.3 secs.
Graph 6
Graph 6 is another velocity/time graph. We moved @ a constant speed of about 0.2 m/s for the first 3 secs.
Then from 3 secs to 6.2 secs, our velocity was about - 0.4. For the rest of the graph, our motion was still.
Subscribe to:
Posts (Atom)