We 80 cm from the motion detector. We walked @ a constant speed... ok... tried to walk away @ a constant speed and we stopped. Then, we walked forward and stopped the rest of the graph.
Graph 2
k for this one, we started @ 3 m, we walked towards the motion detector for @ a constant speed for 3 secs and we stopped.@ 4 secs we continued to walk away and stopped @ 5 secs. Finally, we walked away from the motion detector @ a constant speed until 10 secs.
Graph 3

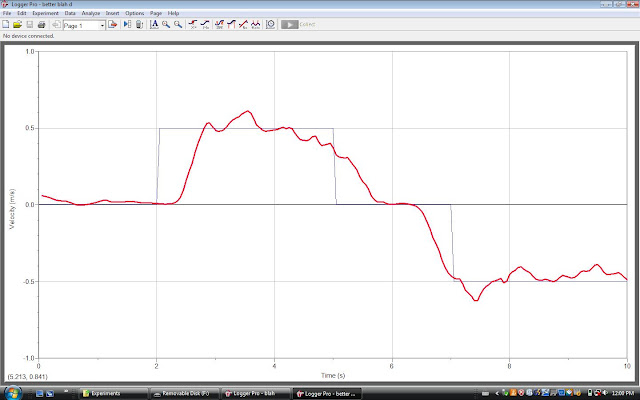
This is a velocity/time graph and it is probably one of the hardest to walk. From 0 to 2 secs, our motion was still. From 2 secs to 5 secs, we were @ a constant velocity of 0.5 m/s. From 5 to 7, our motion was still again. Finally, from 7 to 10 secs, we walked @ a constant velocity of -0.5 m/s.
Graph 4

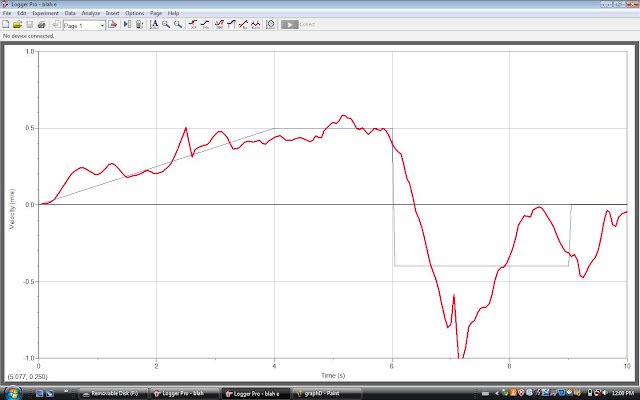
Just when i thought it graph 3 was the hardest one to walk... here comes graph 4. I gotta say... this is the worst result we got in this experiment. Graph 4 is also a velocity/time graph. In the first 4 secs, the velocity increase constantly to 0.5 m/s. From 4 secs to 6 secs, the velocity 0.5 m/s. From 6 secs to 9 secs, the velocity, is about -0.4. @ 9 - 10 secs, our motion was still.
Graph 5

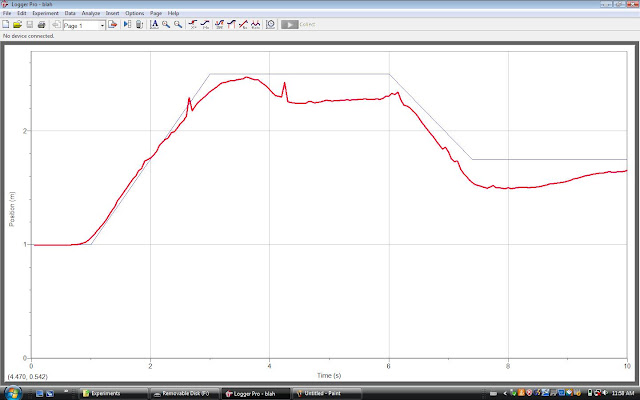
Graph 5 is a distance time graph. From start to about 3.5 secs, we moved away from the motion detector @ a constant speed. Then we stood still and started moving further away from the motion detector @ about 6.3 secs.
Graph 6

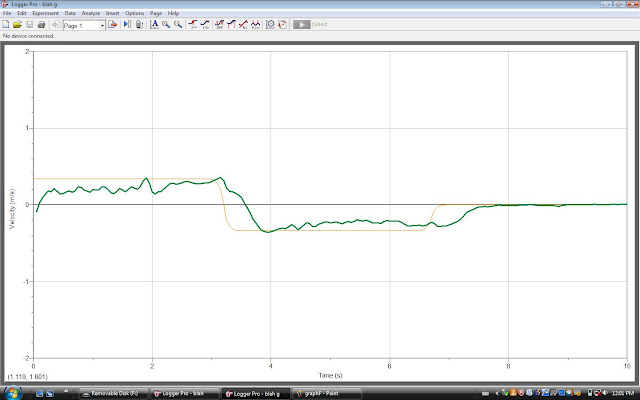
Graph 6 is another velocity/time graph. We moved @ a constant speed of about 0.2 m/s for the first 3 secs.
Then from 3 secs to 6.2 secs, our velocity was about - 0.4. For the rest of the graph, our motion was still.


No comments:
Post a Comment